
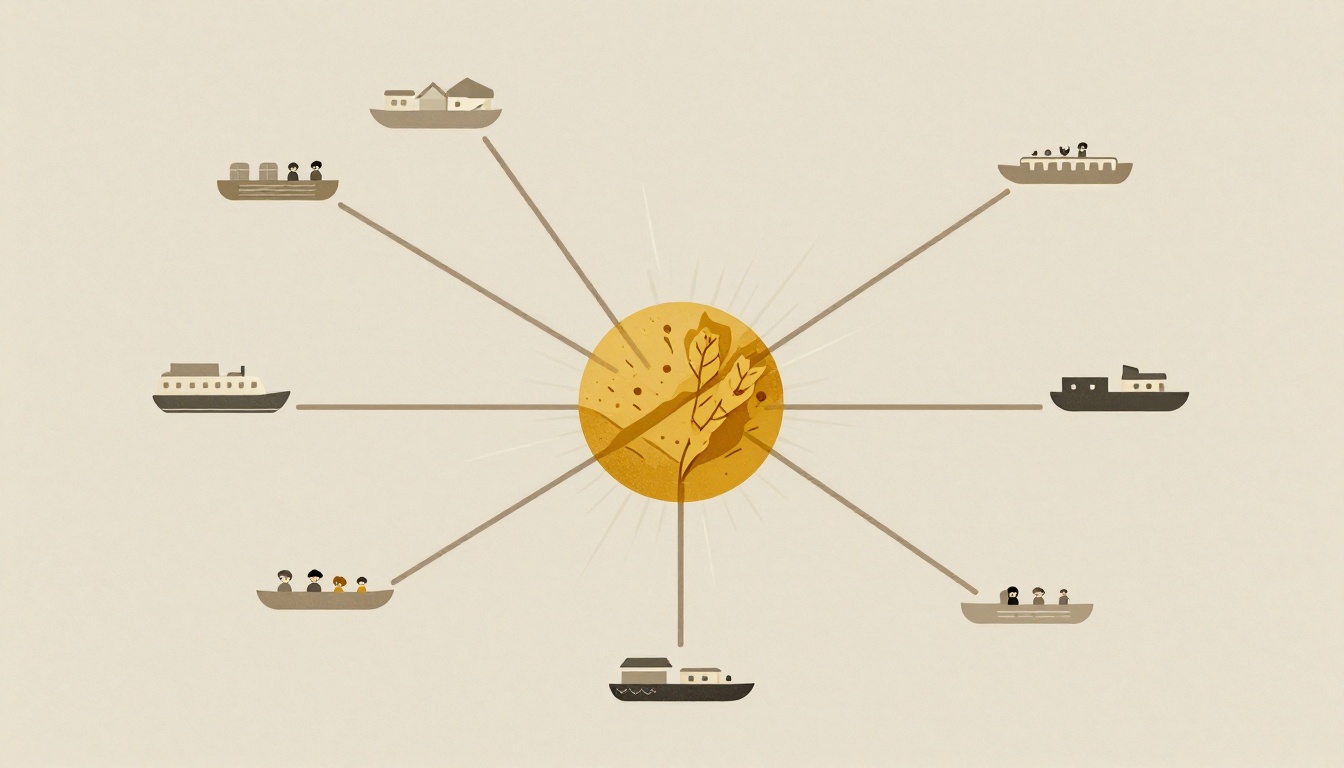
When your usual grain export corridor hits a snag—a port closure, a rail bottleneck, or a geopolitical disruption—your shipments can stall for weeks, costing you time and money. The solution isn't to wait it out; it's to have a pre-planned map of alternative routes. This guide shows you how to build that map, using current market realities and infrastructure data.
What percentage of U.S. wheat export volume was moved by rail between 2016 and 2020?
Select one answer.
Why you need a route map now
Grain export logistics are under pressure from multiple directions. In the U.S., rail remains the backbone of wheat exports, accounting for 59% of inland transportation for wheat exports between 2016 and 2020, according to a USDA modal share study cited by U.S. Wheat Associates. However, capacity problems are most acute during the fall peak shipping season, with farmers complaining of railcar shortages and train delays that cut into profits, as noted in a Congressional Research Service report. Meanwhile, global events are reshaping traditional routes. For example, the Strait of Hormuz disruption in early 2026 pushed more energy demand toward the U.S. Gulf and increased congestion at the Panama Canal, with southbound non-reserved waits reaching 10.8 days, as reported by RFD-TV. This shows how a single chokepoint can ripple across the entire grain logistics network.
Step 1: Assess your current route's vulnerabilities
Start by identifying the single points of failure in your existing export chain. For instance, the Port of Vancouver set export records in 2025, moving over 30 million tonnes of bulk grain, but a single rail bridge from the 1960s is the only route to key grain and potash terminals and carries almost a third of all cargo through the port, according to a LinkedIn post by John Stackhouse. Similarly, in Canada, aging infrastructure like Vancouver's Second Narrows Bridge is creating serious bottlenecks and limiting trade capacity, as highlighted by the Grain Growers of Canada. Map out your route from farm to port and flag any bridge, rail line, or lock that has no redundancy.
Step 2: Evaluate alternative transport modes
For inland moves, rail and barge are the main modes for wheat exports, together transporting 89% of total shipments, per the USDA modal share study. But don't overlook trucking for shorter distances, especially when rail capacity is tight. In the U.S., trucking's share of grain transport has increased substantially over the past two decades, favored for its flexibility in when, where, and how much grain is delivered, as noted in the CRS report. For export moves, bulk carriers are the standard, but consider the loading and unloading infrastructure at alternative ports—can they handle your vessel size and volume?
Step 3: Identify alternative ports and corridors
Look for ports that are expanding capacity or offering new advantages. For example, in the Baltic, Ust-Luga is strengthening its position as a reliable alternative to Black Sea routes, offering greater predictability and improved vessel availability, though longer distances and higher bunker costs increase freight levels, according to the AGROCOR Freight Report. Vysotsk is also gaining importance as a grain export hub, with expanding terminal capacity and potential for larger grain parcels. In North America, consider the U.S.-Mexico border: the Surface Transportation Board approved a proposed second rail crossing at Eagle Pass, Texas, which is the top gateway for overland soybean exports to Mexico, as reported by RFD-TV. This could provide an alternative for overland exports.
Step 4: Factor in cost and reliability trade-offs
Alternative routes often come with higher costs. For Ukrainian grain, alternative export routes via Baltic ports would only work with EU subsidies for additional logistics costs, trade sources told AgriCensus, as reported by OFI Magazine. The Baltic route offers stability but longer distances and higher bunker costs. In contrast, Black Sea routes like Novorossiysk are more competitive due to shorter routes to key markets, but they carry security risks and higher war-risk insurance costs, as noted in the AGROCOR Freight Report. When evaluating alternatives, calculate the total landed cost, including freight, insurance, and potential delays, and compare it against the risk of your primary route.
Step 5: Build a contingency plan with triggers
Don't wait for a disruption to start planning. Create a decision matrix that lists your primary and alternative routes, along with triggers for switching. For example, if rail carloads drop by a certain percentage or port waiting times exceed a threshold, activate your alternative. Monitor key indicators like rail performance, barge movements, and port congestion. The RFD-TV report noted that rail grain carloads rose 8% from the previous week while barge movements fell 11%, showing how quickly conditions can shift. Regularly review and update your plan based on new infrastructure developments and market changes.
How the Featured Expert Can Help
Mindmingle is a commodity trading platform that connects buyers with high-value commodities such as petroleum, soybean oil, sugar, and jet fuel at manufacturer prices. It offers bulk purchasing options and claims to streamline wholesale operations for distributors and wholesalers worldwide. While not focused on grain, its approach to direct sourcing and logistics coordination can inform your broader commodity procurement strategy. Visit mindminglecommodities.com to learn more.
Quiz
Test your knowledge: What percentage of U.S. wheat export volume was moved by rail between 2016 and 2020?
- 59%
- 39%
- 24%
Correct answer: 59% (as per the USDA modal share study).